
Welcome to

Sign up to our newsletter to get access to the top 50 leading ZIP Codes to invest in for 2024 instantly!

Discover. Compare. Analyze. Invest.
Finding your next
investment property
is just one click away.
Get Started
The Investor's Pipeline, Consolidated
Search on Market Properties
Welcome to the first step in your investment pipeline: the Search On-Market Page. Utilize real-time MLS data to scan potential projects and kickstart your property analysis. Our page is divided into two primary components for your convenience:
1. Main Data Display Table
The Propagate Table, an advanced tool designed with the modern real estate investor in mind, offers an extensive analytical perspective of real-time MLS data. Sorted by our proprietary in-house metric, this table offers an insightful evaluation of each property's investment potential. This unique metric examines numerous variables such as market value, property condition, and potential ROI, offering users a robust overview of each listing.
| List Price | Address | Sq. Ft. | Baths | Beds | Lower Rent | Rent Estimate | Upper Rent | Rental Ratio | Price / Sq. Ft. | Market Value (+/-) |
|---|---|---|---|---|---|---|---|---|---|---|
| $135,000 | 1051 Propagate Way | 2,672 | 1 | 2 | $875 | $1,256 | $1,636 | 93.00% | $51 | -58.59% |
| $148,400 | 927 N Propagate Drive | 2,160 | 1 | 2 | $889 | $1,032 | $1,175 | 69.55% | $69 | -43.69% |
| $195,000 | 874 Prpgt Street | 1,875 | 1 | 2 | $954 | $1,289 | $1,624 | 64.45% | $54 | -55.48% |
| $419,900 | 333 Twin Oaks Valley | 2,318 | 3 | 4 | $1,517 | $2,068 | $2,618 | 49.24% | $181 | 48.24% |
| $150,000 | 6000 apeiron Ave | 1,095 | 1 | 2 | $806 | $919 | $1,032 | 61.25% | $137 | 12.28% |
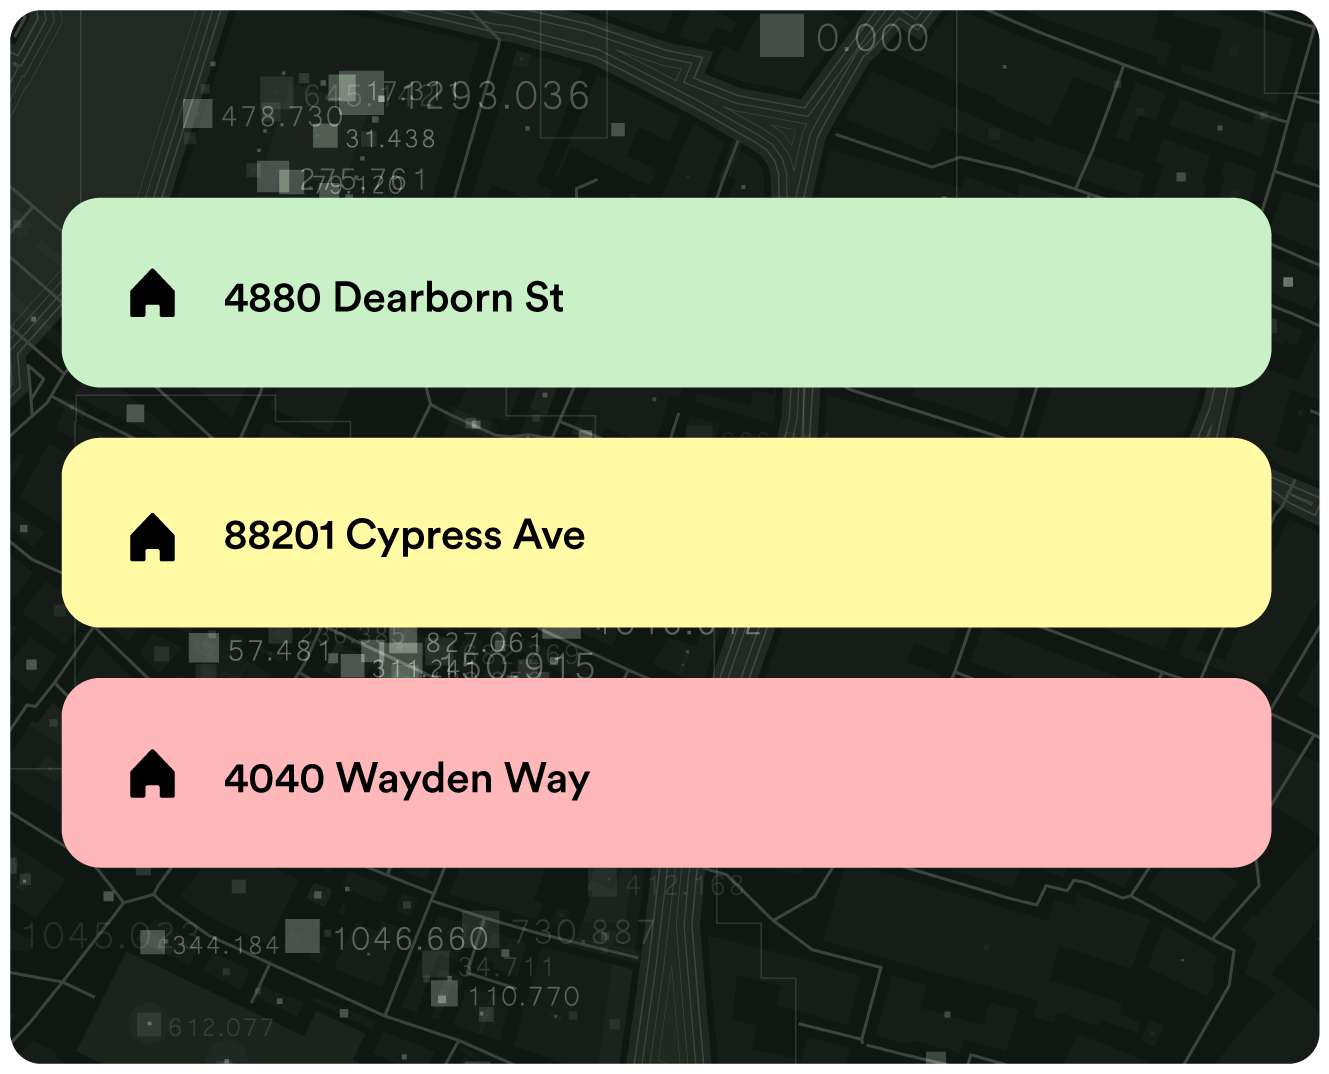
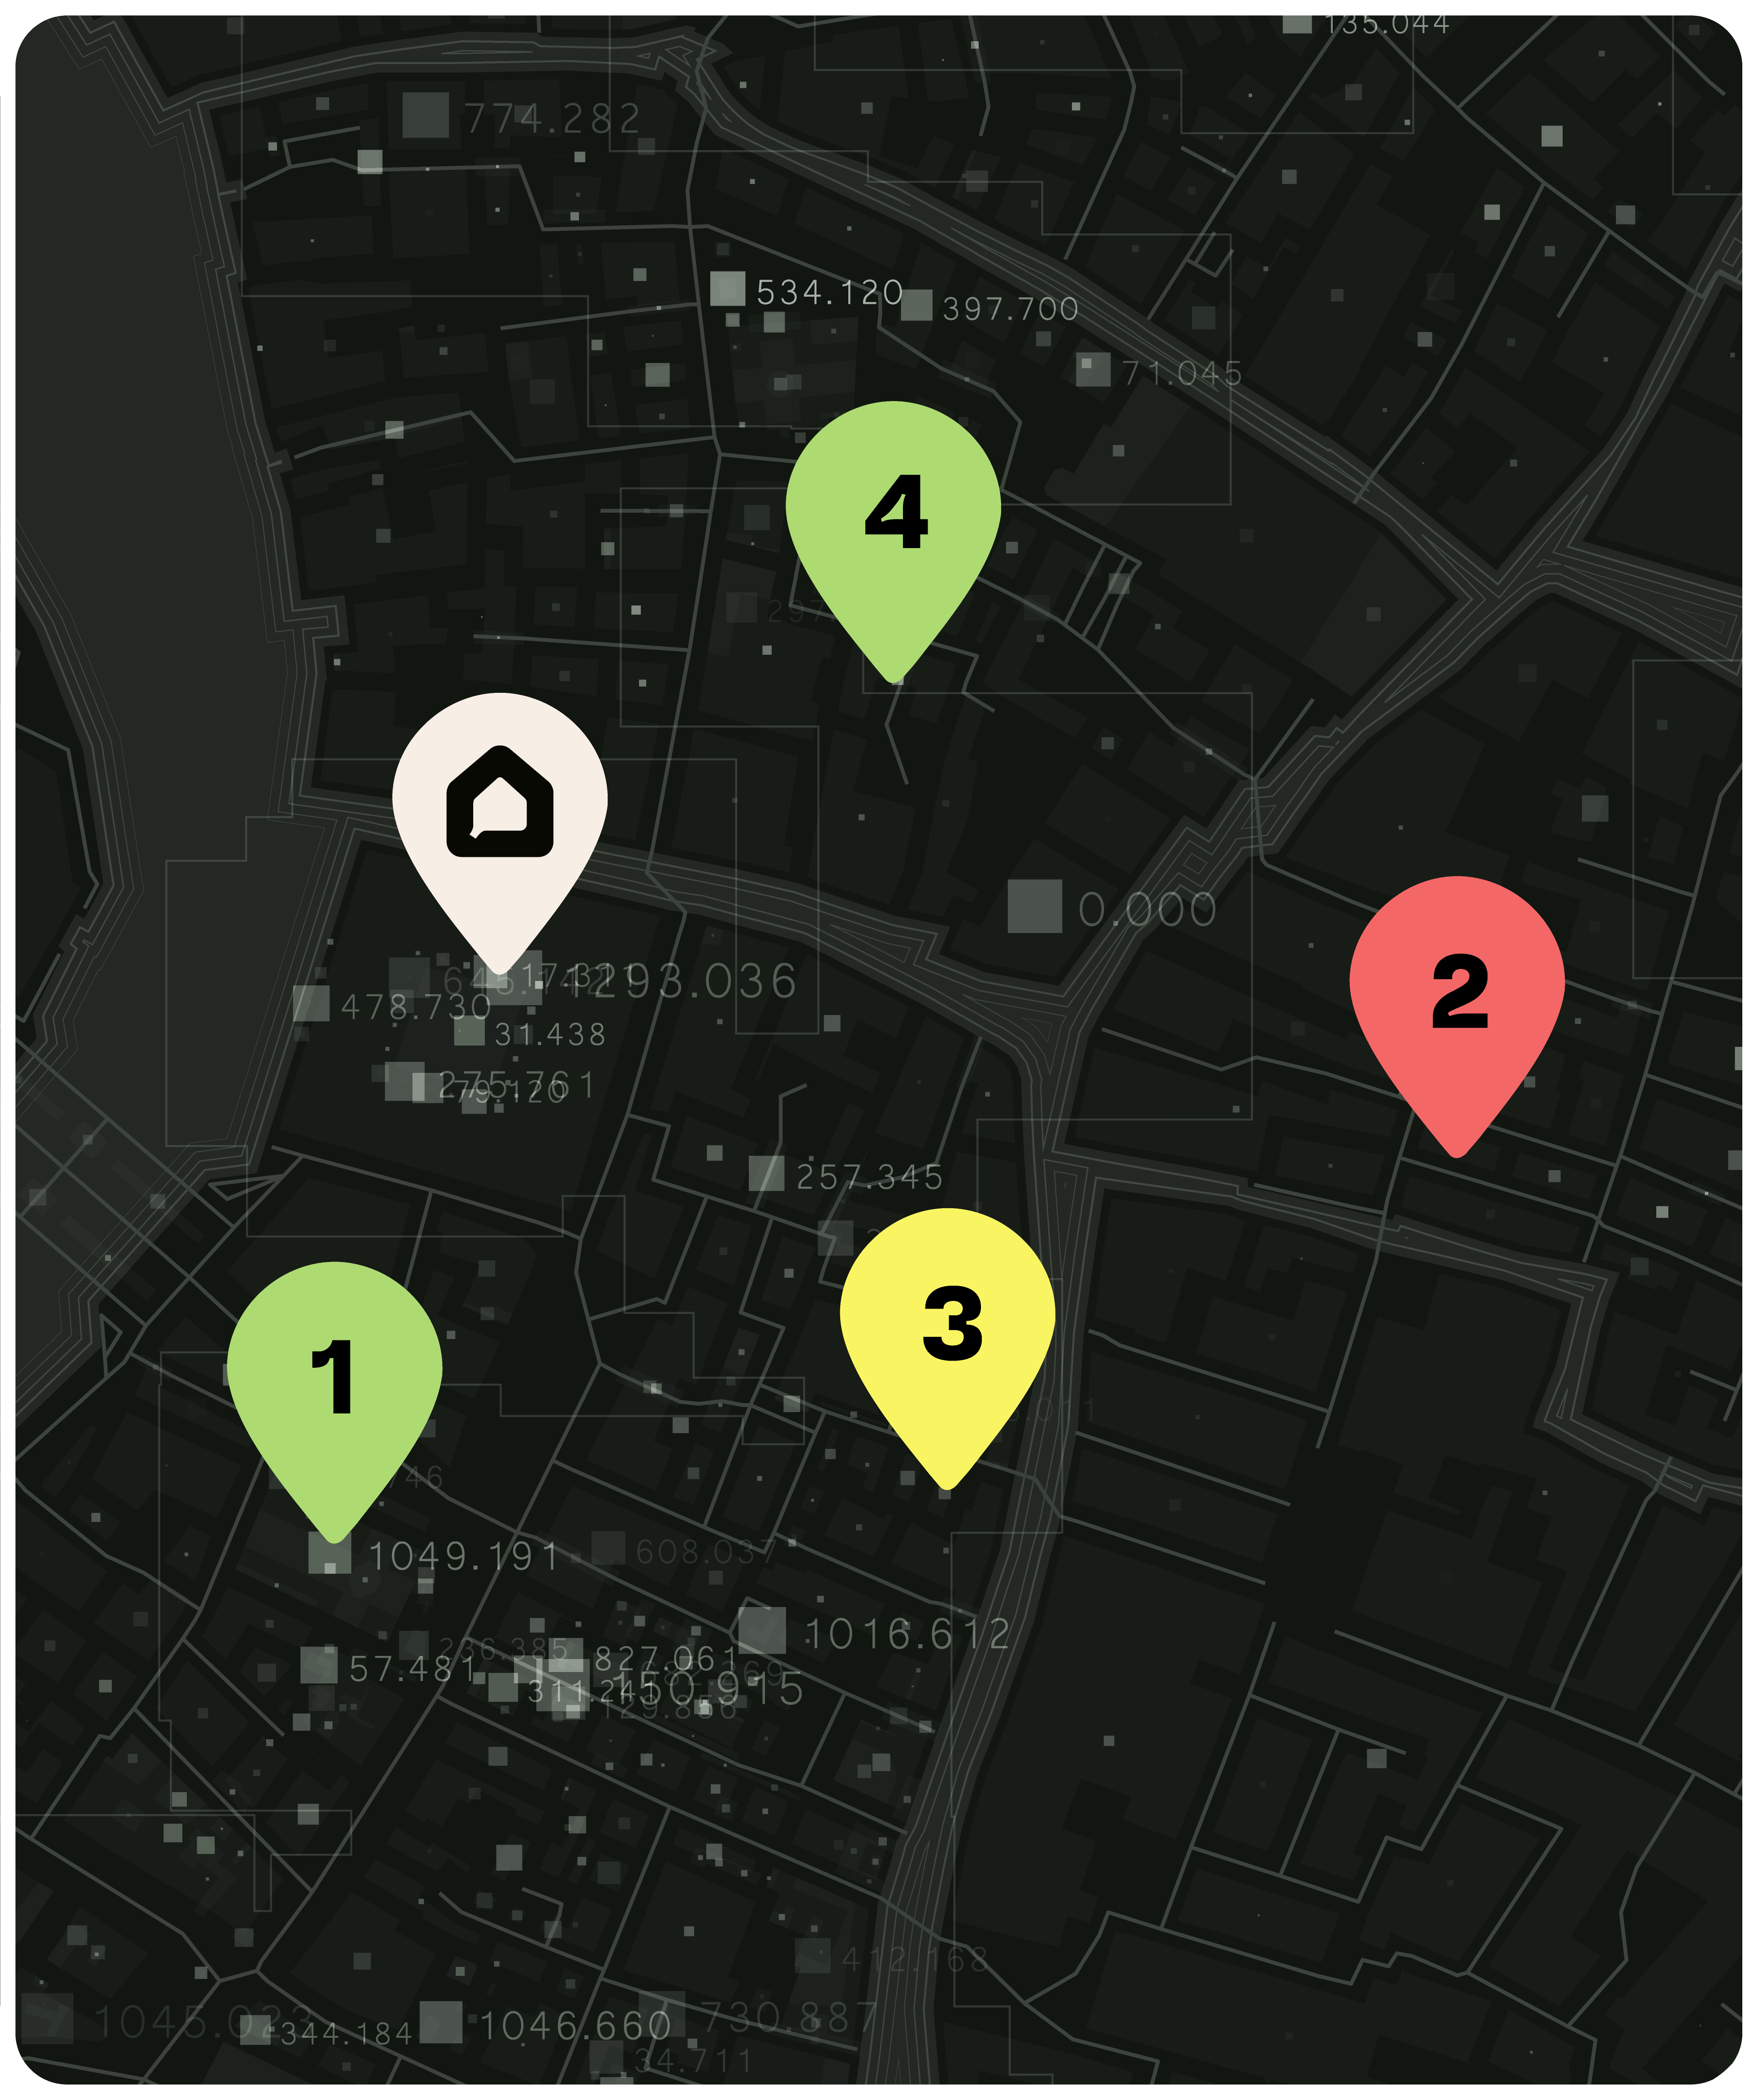
2. Google Map Functionality
We have integrated Google Maps into our platform to visualize property locations, available to our members. Each property marker on the map mirrors its corresponding color on our chart, serving as a quick visual indicator of its investment potential.
Comparables Page
In the continuation of Propagate's operations pipeline, this marks the second pivotal step. Having already located a selection of potentially lucrative properties in step one, we now move to the task of providing you with comprehensive and relevant details about each of these potential properties.
For every property under analysis, we aggregate a total of 7 related data points, all with the aim of supplementing your decision-making process. The initial group of comparables serves the purpose of approximating the ARV (After Repair Value) or potential selling price of a specific property. This entails examining 5 properties that have recently changed hands within a given radius of your choosing, properties that possess similar attributes (number of bedrooms, bathrooms, and overall square footage within a 500 sq ft deviation) to the property you're considering.
Our Comparables tool is a cornerstone of our software, and it is specifically designed to arm you with the data you need to make enlightened decisions about potential investment properties. By pooling together data from both recently sold and currently rented properties, we offer you a holistic view of the real estate market. This empowers you to make informed decisions about your investments.
Full access to the capabilities of our Comparables tool is at your disposal via the Comparable Table. With the aid of our Comparables tool, you're well-positioned to save time, stay informed, and make the best choices for your real estate investments. This process, forming the second step in our operation pipeline, continues to build on the initial property selection, offering you a platform for real estate investment analysis.
Analytics Page
In this phase, we equip you with three dynamic calculators: the Max Bid Calculator, the BRRRR Calculator, and the Total Repair Cost Calculator. These tools are designed to help you better understand and navigate the financial landscape of real estate investment.
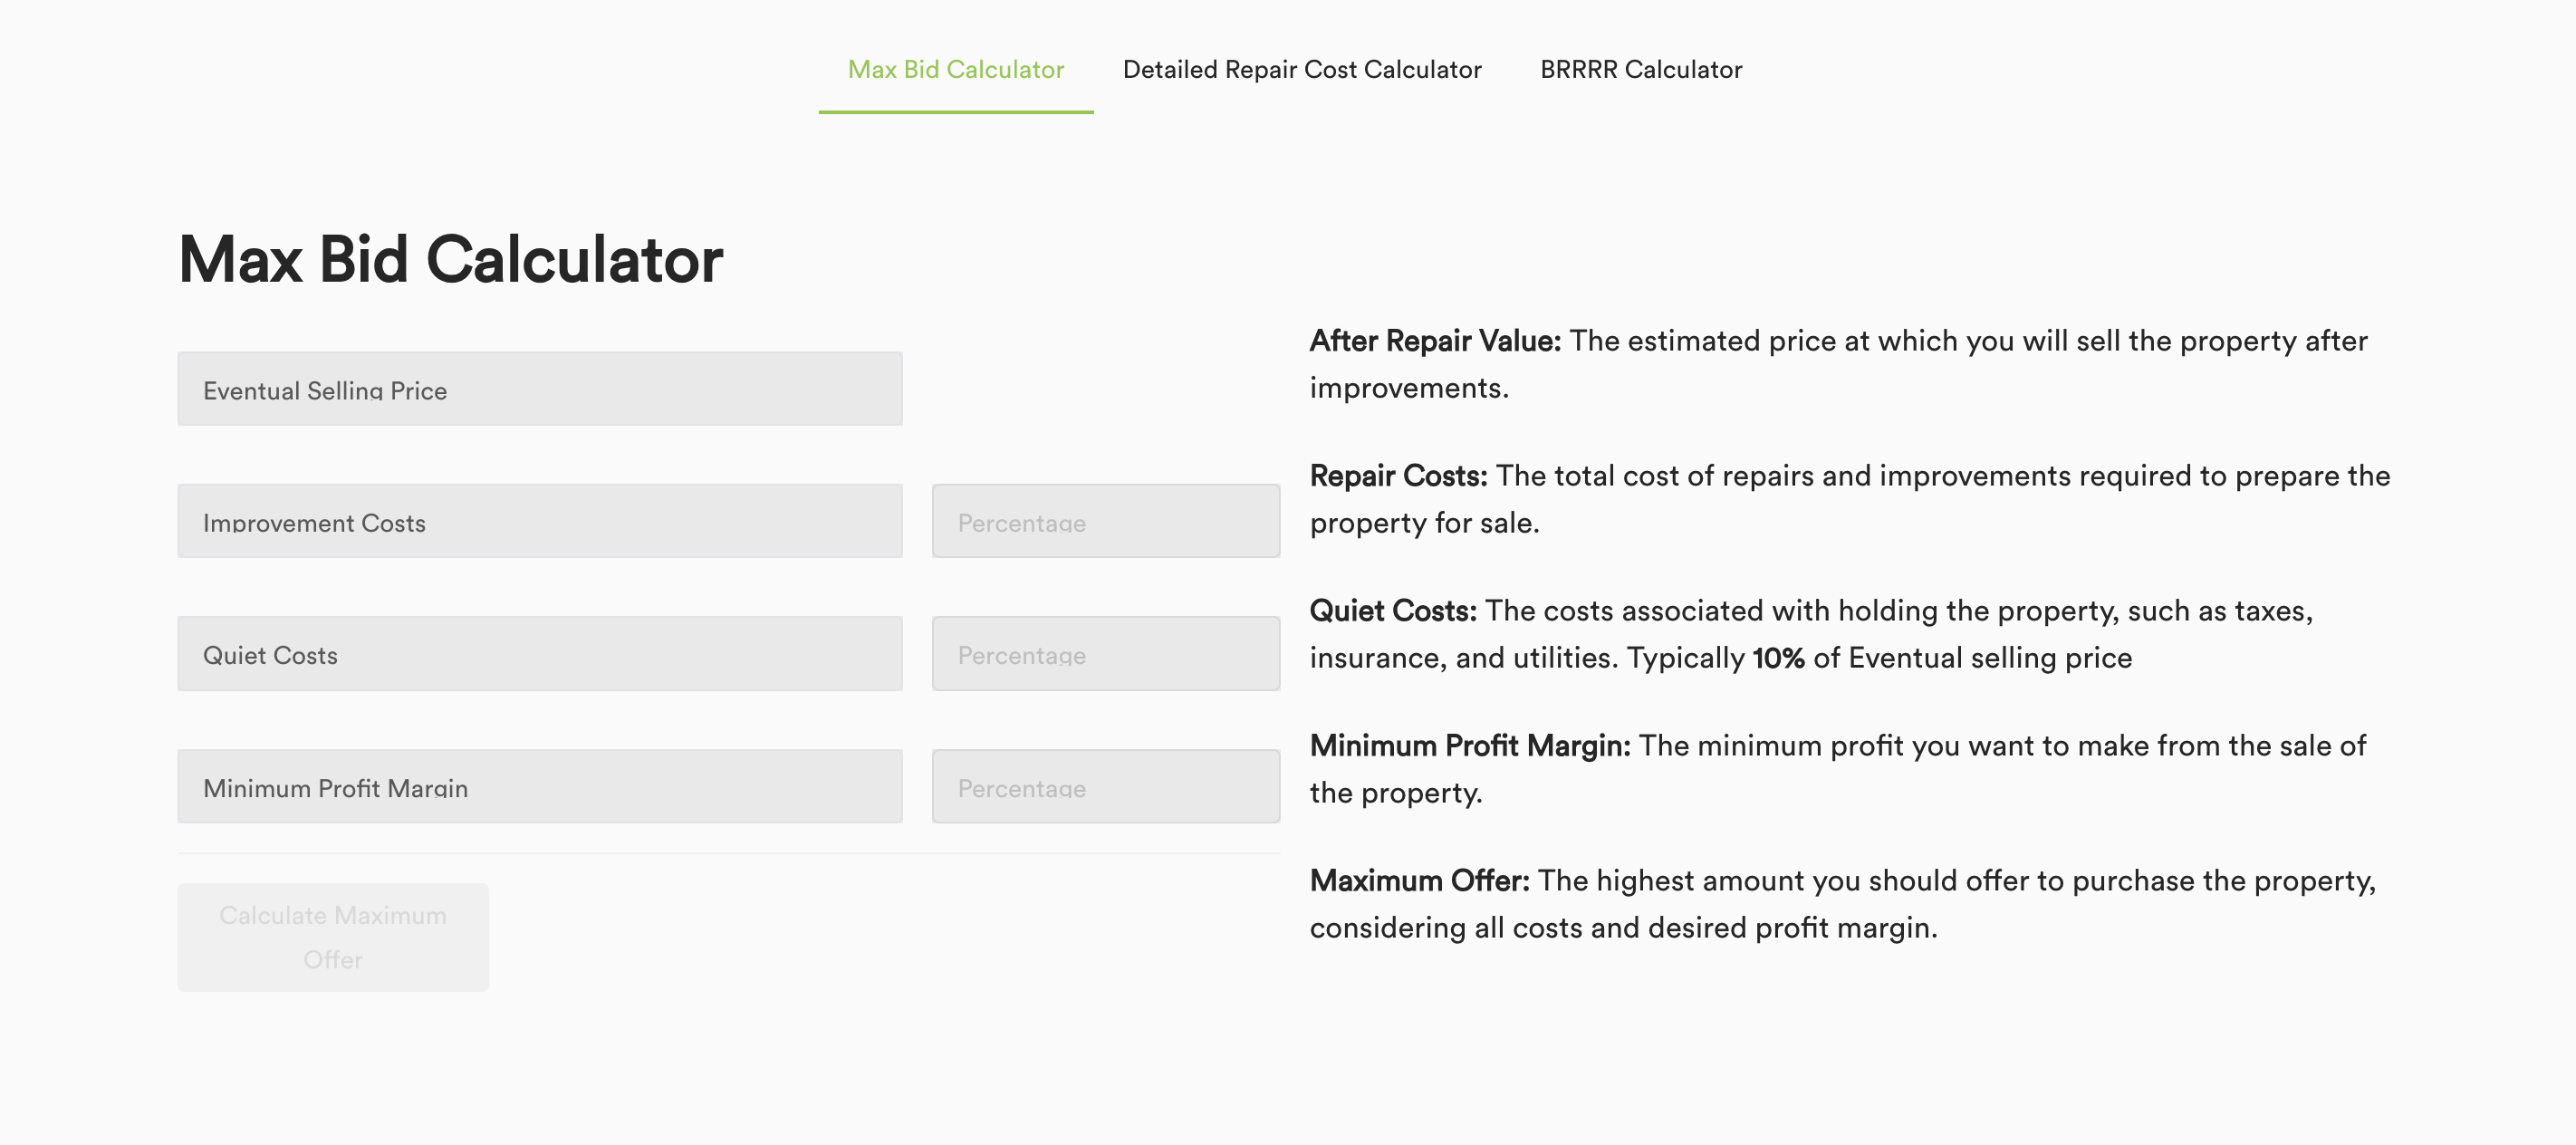
1. After Repair Value Calculator
The Max Bid Calculator uses the property's details, rehab estimates, and your desired profit to calculate the maximum price you should be willing to bid for the property, ensuring that your investment remains profitable.
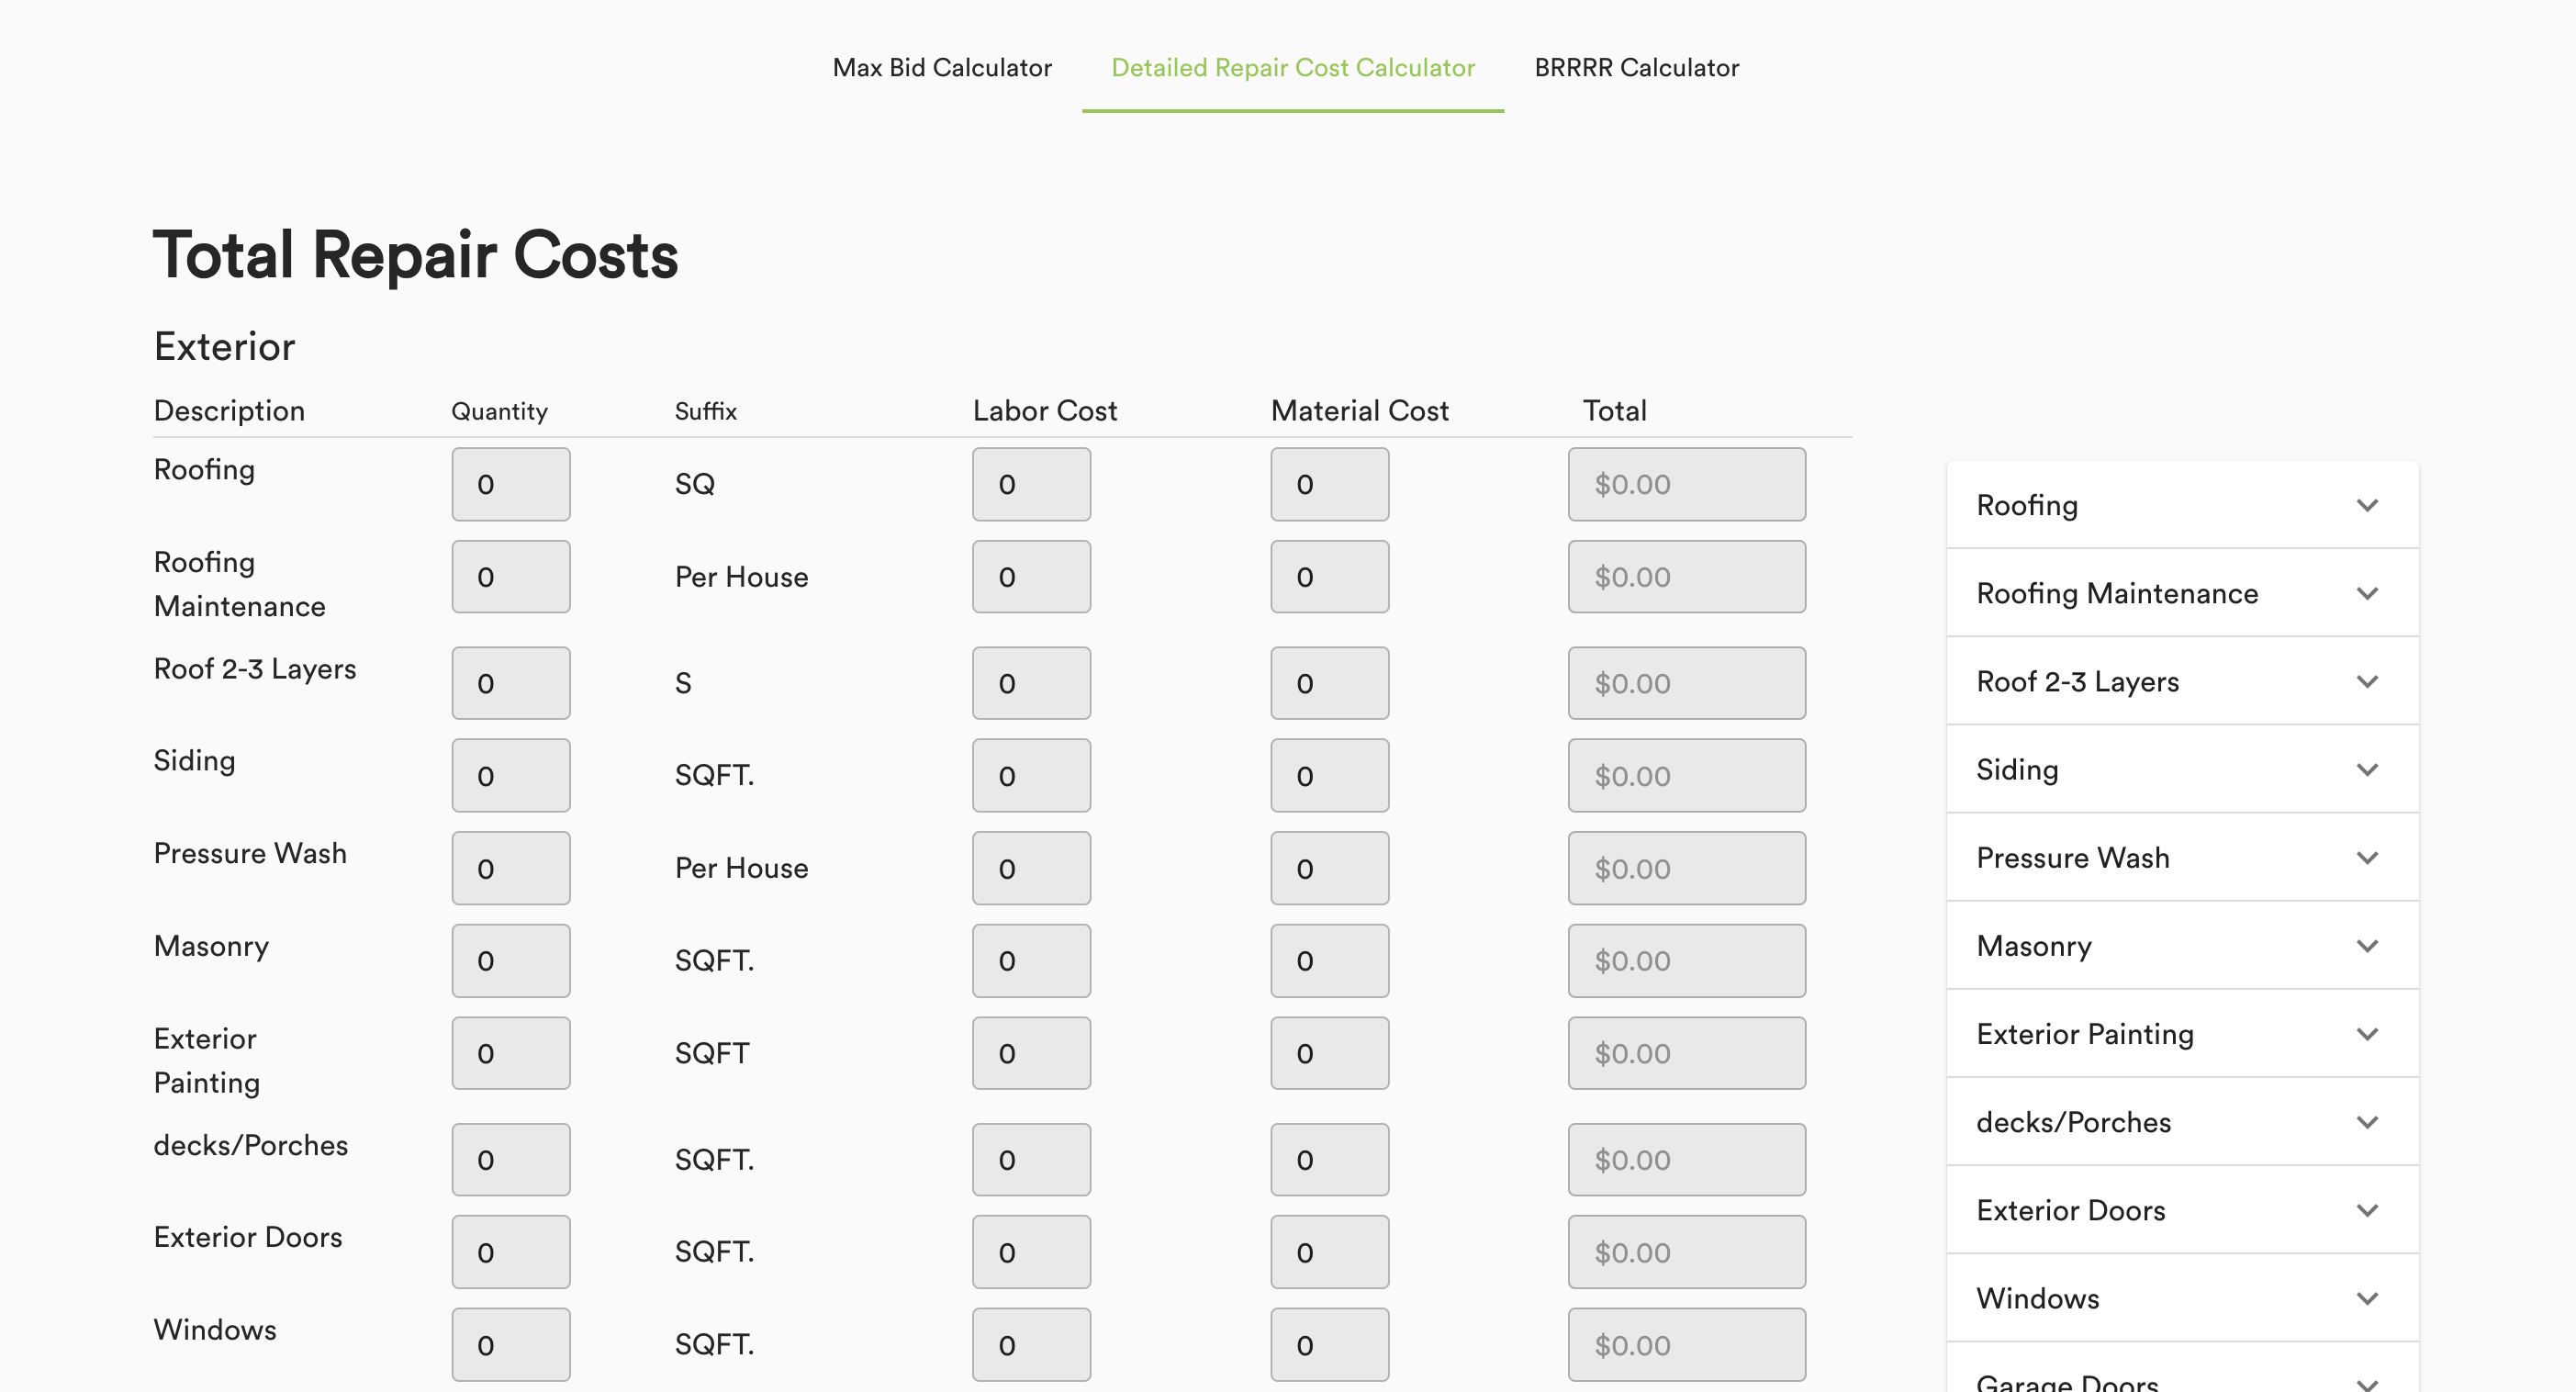
2. Total Repair Cost Calculator
The Total Repair Cost Calculator offers an estimate of the total cost of repairing and renovating a property. This tool gives you a detailed breakdown of potential renovation costs, helping you to understand the financial commitment involved and to budget appropriately for a renovation project.
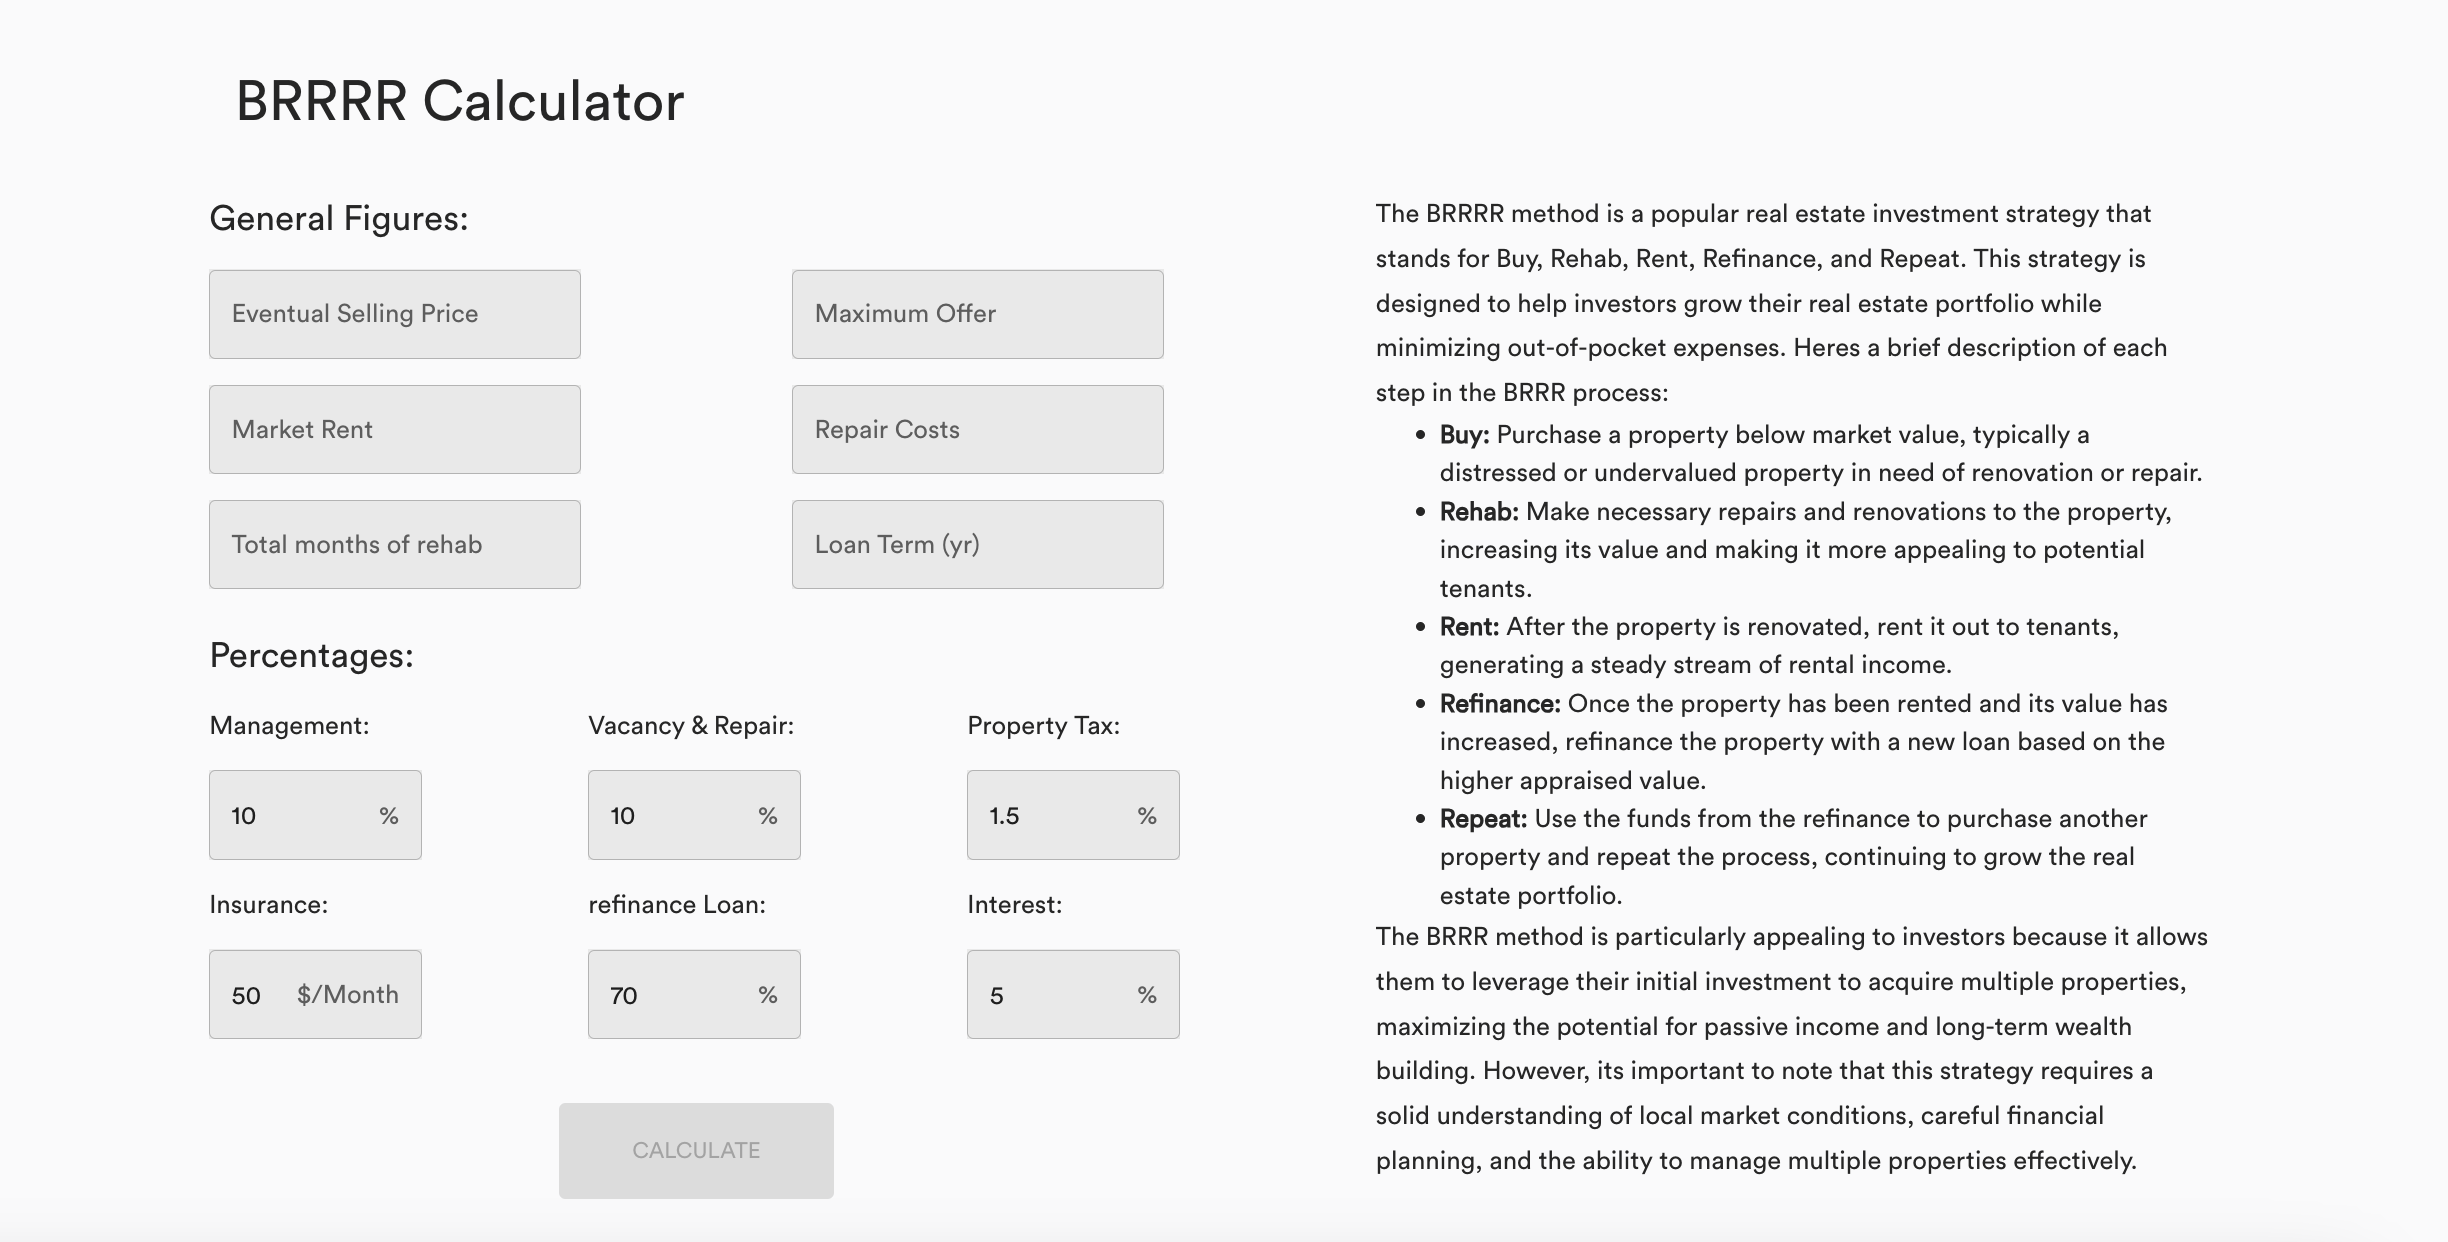
3. BRRRR Calculator
The BRRRR method is a popular real estate investment strategy that stands for Buy, Rehab, Rent, Refinance, and Repeat. This calculator is designed to help investors grow their real estate portfolio while minimizing out-of-pocket expenses.
Together, these calculators form the backbone of the third step in our pipeline. By integrating these powerful analytical tools into our software, we continue to build upon the information gathered in the first two steps, providing you with the insights you need to make strategic, data-driven decisions in your real estate investment journey.
Project Planner
At the fourth and final stage of Propagate's operation pipeline, we present the Project Planner. After you have identified potential properties, collected comprehensive details, and analyzed them using our calculators, the Project Planner facilitates the efficient organization and easy accessibility to your projects.
Furthermore, the planner empowers you with complete control over your projects. You can effortlessly add new projects as opportunities arise or delete existing ones if they no longer align with your investment strategy. This makes managing your portfolio a breeze.
The Project Planner not only serves as the final step in our operation pipeline but also acts as the hub of all your real estate planning activities. It takes all the data gathered and insights generated in the previous steps and brings them together in an organized, user-friendly format, allowing you to plan and execute your real estate investment strategies with precision and confidence.
Project PDF
Our project PDF feature provides you with an overview of your property analysis. With just a few clicks, you can generate a personalized PDF report that covers all the essential details of your potential investment.
Page 1: Project Details
The first page of the PDF includes all the vital information about the property you are considering. You'll find key metrics like square footage, listing price, and more. Additionally, we extract the description provided by the listing realtor, allowing you to get a deeper understanding of the property's unique features. To help you evaluate the potential rental income, the PDF also provides estimated rent figures based on market data. This way, you can quickly assess the property's cash flow potential and make informed decisions.
Page 2: Comparables
On the second page, you'll find detailed information about comparable properties in the area. The PDF includes a map displaying the locations of these properties, a table with relevant data, and estimated values for each comp. This valuable information enables you to gauge how your potential investment stacks up against similar properties in the neighborhood.
Page 3: Analytics from Calculators
The third page is dedicated to the results from our powerful calculators. These calculators help you analyze the property's potential returns, repair costs, and maximum offer price, respectively. The PDF presents these valuable analytics to give you a clearer picture of the investment's financial viability.
It's important to note that the purpose of the PDF is to provide you with a general idea of the property's potential. It should not be seen as a substitute for a detailed analysis. Whether you want to share it with clients or present it to potential investing partners, the PDF report is an effective tool for conveying essential property information.
Want to see an example PDF? Click the button below to view it:
Subscription Features
Billed Yearly
Billed Monthly
Trial
Free
- 5 Properties Per Search
- 5 credits
- Max of 3 projects in the Project Planner
- 7 Days
- All other benefits of Enterprise
Starter Investor
$32.99
- 15 Properties Per Search
- 25 Credits Per Month
- Max of 10 projects in the Project Planner
- Max Bid Calculator
- BRRRR Calculator
- Export Search Table as CSV or Excel
- Comparables Search and Analysis
- Project Planner
Pro Investor
$83.99
- 30 Properties Per Search
- 50 Credits Per Month
- Max of 20 projects in the Project Planner
- Max Bid Calculator
- BRRRR Calculator
- Total Repair Cost Calculator
- Rental Info
- Export Search Table as CSV or Excel
- Comparables Search and Analysis
- Project Planner
Enterprise Investor
$216 $134.99
- 40 Properties Per Search
- 60 Credits Per Month
- Max of 50 projects in the Project Planner
- Max Bid Calculator
- BRRRR Calculator
- Total Repair Cost Calculator
- Rental Info
- Export Search Table as CSV or Excel
- Comparables Search and Analysis
- Project Planner
- Expert Project Analysis Report
- Early Access to new features